

Azure Traffic Analytics in 10 minutes
- Roman Guoussev-Donskoi

- Sep 30, 2019
- 2 min read
Updated: Oct 9, 2019
Azure Traffic analytics in combination with NSG flow logs version 2 help you better understand capacity utilization and maintain compliance on the network.
One of my favorites it the capability to capture and analyze throughput information (Bytes and Packets).
Since NSG flow logs are stored only within a storage account to gain insights into network traffic once needs to use custom reports (e.g. Power BI) or Traffic Analytics.
Setup
Setup is very simple and assume for most Azure environments you would use automation
for example to enable Traffic Analytics and NSG flow logs version you would use:
For more details refer to Configuring Network Security Group Flow logs with PowerShell
( Windows PowerShell from version 6.2.1 onwards)
By default Traffic Analytics collected from storage account every hour, which you can check in Azure portal
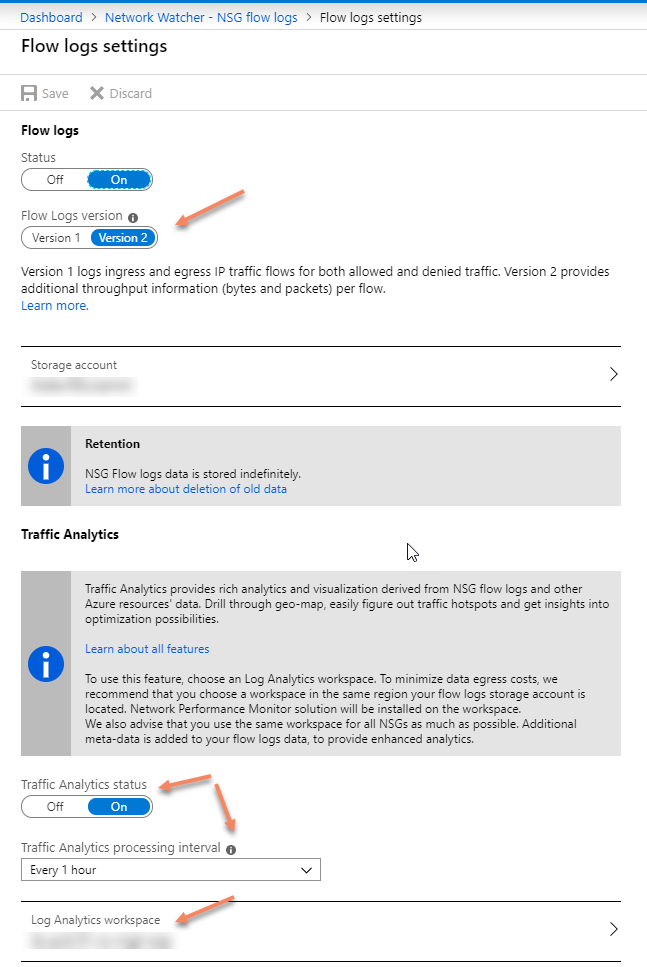
or using PowerShell (pass Network Watcher and NSG id as parameters)
You can see in example below Traffic Analytics has been configured and the polling interval 60 minutes.

Use
Once Traffic Analytics has collected the information you can start analyzing your traffic. You can select where you want to display throughput in flows, bytes, or packets.

Security
It is definitely work start with checking the endpoints participating in traffic marked as malicious.
Click in red bar (screenshot above) representing malicious traffic to get the details.

Click on angle to see the details of the captured malicious flow record
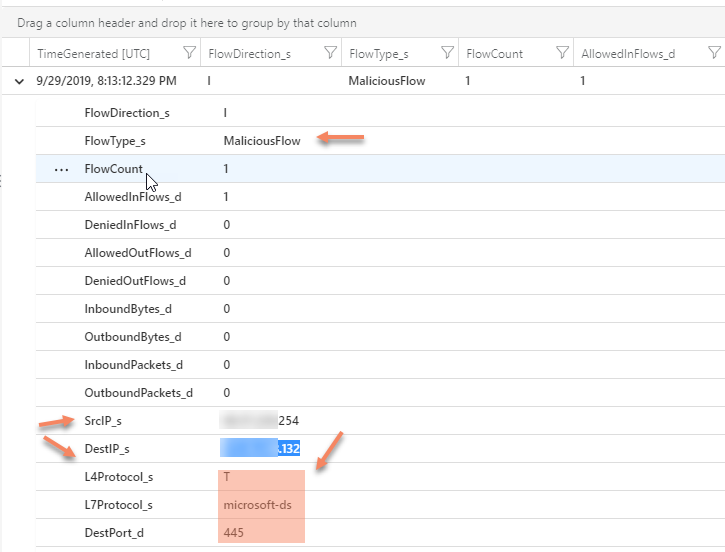
If the identified endpoints are network interfaces of your perimeter firewalls then those are expected attack targets . Any others should trigger investigation and security incident handling protocols. You can use queries to exclude those when querying the logs.
Throughput
You can identify NSG rules involved in processing of most traffic

You can identify most talkative source and destination pairs, as well as vNet and subnet involved.

And if you ant to drill-down deeper you can click on "See more"

And if you want even deeper drill-down or write your own custom queries again click on see more and it will bring you to log analytics query screen with predefined queries that you can customize to better fit your needs.
Custom Queries
Traffic Analytics power significantly increases once you start writing your own queries. For example you want to find IP connections that generate most inbound volume within given time range. Then you could do something similar to below

Cost
Whenever extending your monitoring is worth checking the cost.
Traffic Analytics feature is billed for log data processed by the service ( $2.30 per GB-processed as of 29 Sept 2019) and for the resulting data ingested into the Azure Log Analytics service. Corresponding charges also apply for logs ingested to the Azure Log Analytics service.
You can monitor you usage in Azure EA portal or via consumption Insights API
Example of Azure Consumption Insights costs for Traffic Analytics processing is below (we load it into Power BI for easier analysis).
We can monitor daily Traffic Analytics cost for each NSG.

Hope this brief overview of Traffic Analytics or additional capabilities of NSG logs version 2 was useful and encouraged to leverage it in your Azure infrastructure tool set.

Comments